It is good to see an article about sea rise and the risk it poses to this area, this is a hugely important topic that needs more discussion. The author mentions global warming but did not explain why this is occurring.
The understanding of climate change is solid science. To quote NASA: “multiple studies published in peer-reviewed scientific journals show that 97 percent or more of actively publishing climate scientists agree: Climate-warming trends over the past century are extremely likely due to human activities”. The rate of sea level rise has not just ‘apparently’ speeded up, this is measurable. It is the exact opposite of what one reader’s comment to the article described as ‘populist talk’. This is an urgent matter and robust science fact, which requires explaining with clarity and certainty. Action is needed now.
It does not help to think of sea rise as a smooth and even process, as if a bath were being filled. A 3’ rise in sea level, combined with high tides and storm surges, exacerbated by more frequent and extreme weather events as predicted, would cause massive damage to many areas of the globe. Likewise, the use of the term ‘global warming’ is misleading, as it can suggest a uniform and gradual temperature rise, whereas the complexity of geography and weather can actually lead to some seasons being colder in some areas. ‘Climate change’ is therefore the preferred term.
In response to comments that the north west of Britain is rising and the south east is sinking, this has long been known and is due to a geological process called isostatic rebound. However, this effect is not nearly as significant as sea level rise due to climate change. The Thames Barrier needed to be closed 50 times during 2013-14, compared to 4 times during the entire 1980s. It is precisely because of climate change that there is now talk of a larger second barrier.
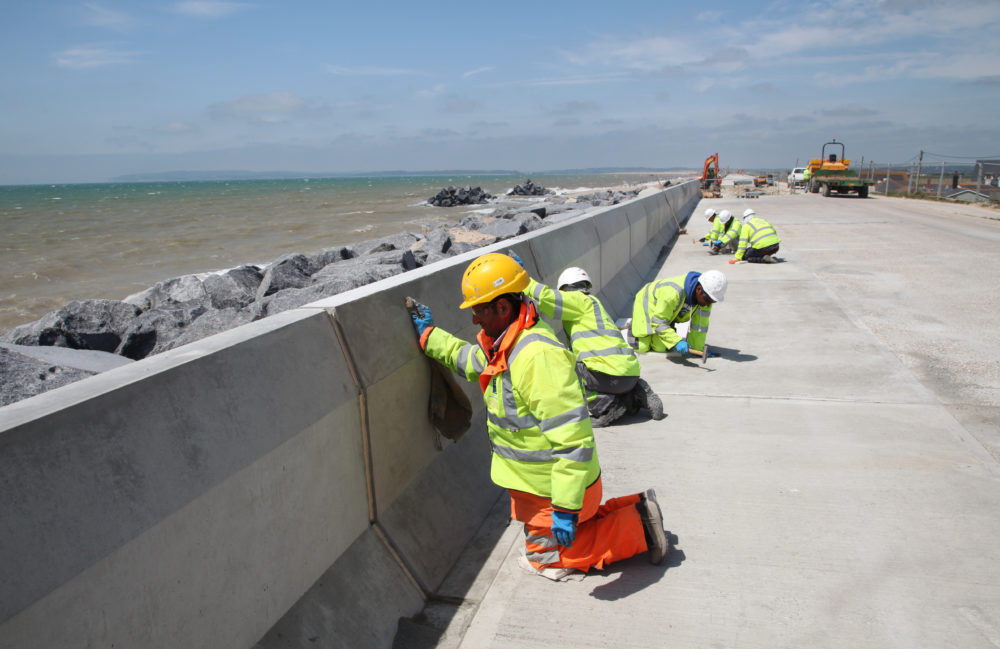
Another reader has commented that sea had receded near Camber and golf was now played where, as a boy many years ago, he could swim. The shoreline around Rye is heavily managed and has been for decades, centuries even, otherwise it would be constantly changing far more than it is. Most of Romney Marsh is below the sea level at high tide, so needs protecting. Most recently £30m was spent forming the Broomhill Sands sea defence. Shingle from Rye Harbour needs to be transported to the west on a constant basis to counteract longshore drift.
Image Credits: Broomhill Sands Project 2017 / JT Mackley & Co Ltd .


Yes times are changing…and we can’t change that. The best we can hope for is that ‘mitigation’ can slow things down. Remember the saying from the fifties, ‘Protect and Survive’ so if Rye wants to survive serious consideration will have to be given to a barrage for the tidal Rother.
Meanwhile, sea levels on the east coast have been rising at a rate of just 1.89mm per year since the start of the 20th Century and show no signs of increasing (source: NOAA Tides & Currents).
Perhaps a little less faith in computer modelling is called for?
Observed and analysed sea level data (from tide gauges, not models) is available from the Permanent Service for Mean Sea Level, based at Liverpool. (https://psmsl.org/)
The sea level rise at Southend from 1933 to 2015 was +1.25 ± 0.16 mm per year. This is relative to the land, so adding in the post-glacial sinking of the land in south east England gives an overall sea level rise of a few mm per year in our region. Not very much per year is it? So why worry?
Well, an extra rise of 200mm (occurring within a generation with the existing rate of rise) changes the frequency of occurrence of a present 1 in a 100 years mean sea level to about 10 years or less. Add in high tides and storm surges on top of this mean level and we, especially our children and grandchildren, have got a problem.
Graham Alcock (ex Ashenden Avenue, Rye and ex UK’s Proudman Oceanographic Laboratory)
The NOAA (National Oceanic and Atmospheric Administration (of the United States)) states that the average increase in sea level at Dover is 2.26mm per year based on monthly mean sea level data from 1961 to 2016. That would suggest a significiant acceleration since the start of the 20th Century if the average is, as Gary Cooper reports, 1.89mm per year over the longer period!
We face an oceanic High Noon!